
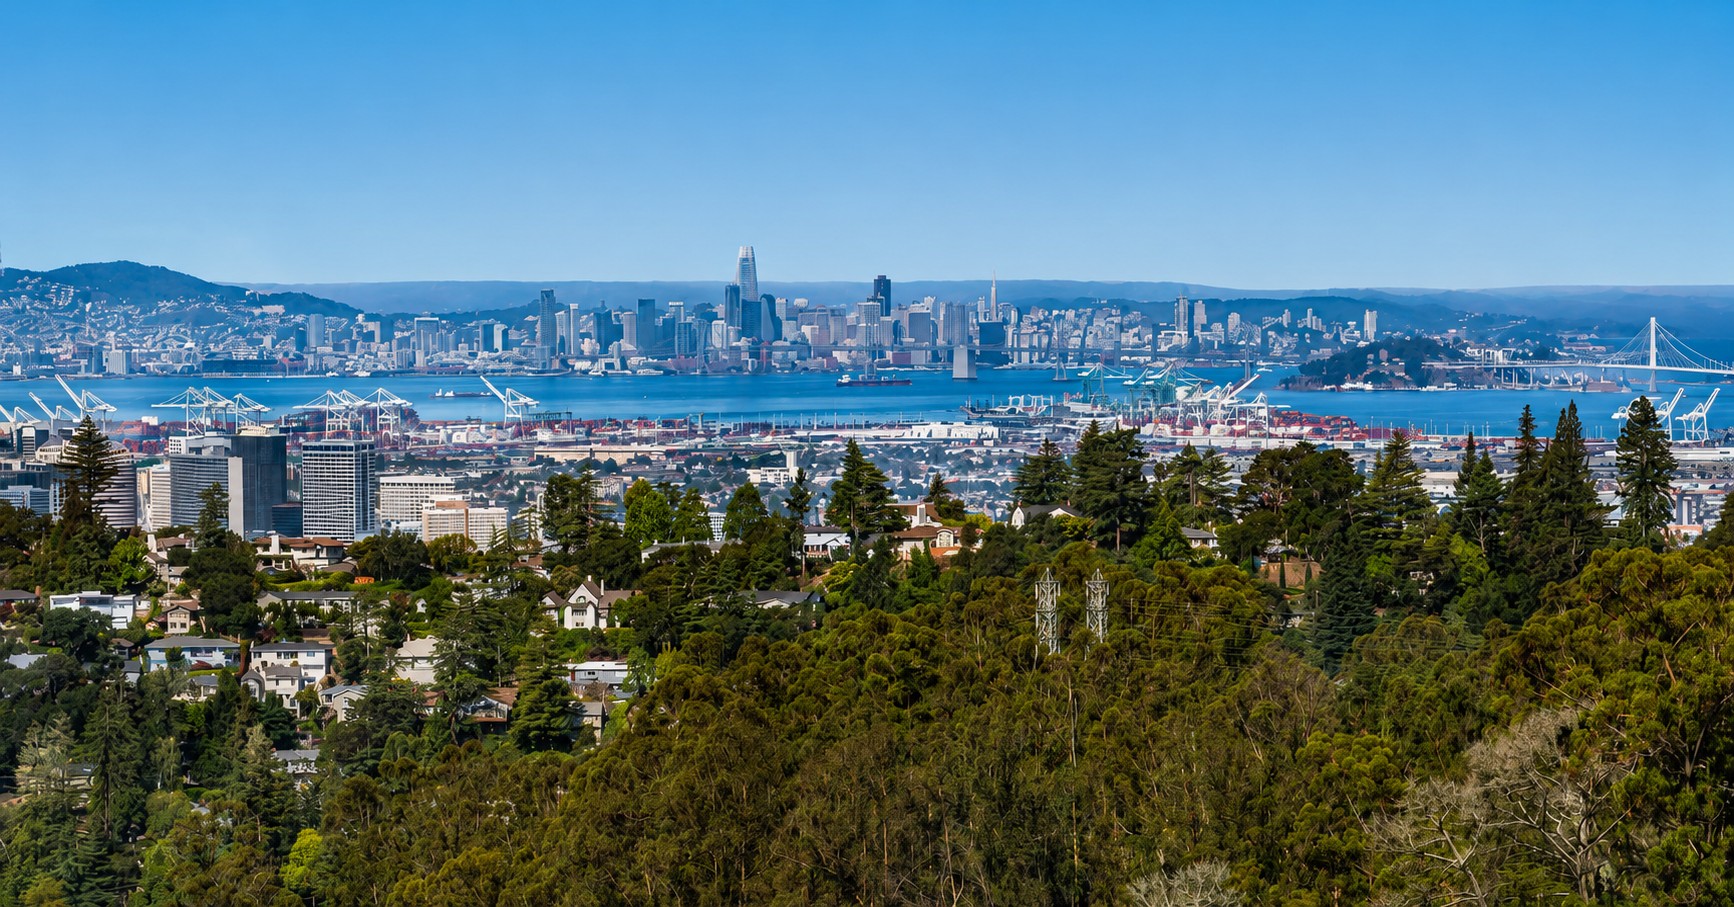
Should You Sell in the Oakland Hills Now?
Published:
Author:
If you’ve been weighing whether to sell in the Oakland Hills, current market data offers a clearer answer than most headlines suggest. Two questions come up again and again: is now a good time to sell, and are rising interest rates starting to work against home prices in the neighborhood? Recent MLS activity across Montclair, Piedmont Pines, and Merriewood, paired with the latest mortgage rate data, points to specific answers to both.
Oakland Hills Inventory: Slim Pickings for Buyers
Inventory is the first place to look when deciding whether the market favors sellers or buyers, and the Oakland Hills numbers are telling. Of 100 detached-home listings tracked across the Hills during this year’s spring-and-summer window, only 18 remained active. The rest had already sold or gone into contract, putting the sell-through rate at roughly 82 percent.
That’s a thin slice of unsold inventory for buyers to choose from, and it means well-prepared, realistically priced listings aren’t sitting around waiting for offers. When active inventory stays this low relative to demand, sellers generally have more negotiating leverage and buyers face more competition for the homes that do come up.
The imbalance isn’t confined to one pocket of the Hills. It shows up whether the comparison set leans toward smaller starter homes or larger view properties, which suggests it’s structural for now rather than a blip tied to a single price segment.
How Fast Homes Are Moving: Days on Market
Speed tells a similar story. Homes that sold in the window spent a median of 13 days on market before going pending, with an average of about 16 days. Homes still sitting active averaged 31 days on market, with a median of 27.
That gap matters. It usually points to pricing and presentation, not a lack of buyers. Homes that come to market priced and prepared to reflect what Oakland Hills buyers are actually willing to pay tend to attract offers within two weeks. Listings that linger closer to a month are more often facing a pricing mismatch, a location or condition issue, or a marketing gap than a soft market overall.
What Recent Sale Prices Reveal
Among Oakland Hills homes that sold in the window, the median sale price came in at $1,450,000, with an average of roughly $735 per square foot. Sixty of the 70 recorded sales, or about 86 percent, closed above the original list price, and 66 percent drew two or more offers.
Those numbers come with an important caveat: a high sale-to-list ratio in the Hills often reflects pricing strategy as much as raw appreciation. Many listing agents intentionally price below anticipated value to generate competition, so a home selling well over list doesn’t necessarily mean values jumped that much — it usually means the pricing strategy worked as designed. Even so, the underlying signal holds: demand has been deep enough that well-positioned homes draw multiple, competitive offers rather than sitting and negotiating down.
Comparing the earlier and later portions of the same window, the average sale-to-list ratio eased from about 130 percent to about 125 percent, and price per square foot softened modestly. Days on market, meanwhile, got a touch faster. Read together, that looks less like a cooling market and more like one settling into a still-competitive, slightly less frenzied rhythm. That easing in overbids is also the metric worth watching most closely this fall.
18 Active Listings
Out of 100 tracked listings, only 18 remained on the market, a sell-through rate near 82 percent.
13 Days Median (Sold)
Sold homes went pending in a median of 13 days, versus 27 for homes still active.
$1.45M Median Sale Price
Averaging about $735 per square foot across Oakland Hills homes sold in the window.
66% Multiple Offers
Roughly two out of three sold homes drew two or more competing offers.
The Price Range Across the Hills
The data also makes clear how much range exists within the Oakland Hills market. Sold homes closed anywhere from about $750,000 to $3,500,000, and active listings span roughly $799,000 to $2,395,000. That’s a wide spread, and it means broad averages only go so far when you’re pricing a specific home.
A three-bedroom fixer on a smaller lot and a five-bedroom view home with recent renovations are both part of the same market, but they compete for different buyers, sell at different paces, and respond differently to pricing strategy — and, increasingly, to financing costs. Market-wide numbers are useful for understanding direction and momentum, but the right list price for any individual home still comes down to a close comparison against its true peer group, not the neighborhood average.
Are Rising Interest Rates Hurting Prices in the Oakland Hills?
Rates have moved meaningfully since spring. Freddie Mac’s weekly survey put the average 30-year fixed rate at 7.03 percent as of September 24, 2026, up from just under 6.5 percent in early July and from 6.30 percent a year earlier. That’s the highest weekly reading since January 2025, and it marks a real shift from the mid-6 percent range that held through most of the summer.
Through the spring-and-summer sales window, the Oakland Hills data didn’t show rates weighing on prices. Days on market stayed short, absorption stayed high, and the large majority of sales closed above list with multiple offers. Demand for well-located hillside homes outpaced the limited supply, and that was a stronger force on local pricing than the national rate environment.
The important caveat is timing. The latest jump is too recent to show up in closed sales, since most homes that closed this summer went into contract when rates were still in the mid-6 range. Rate changes tend to surface first in showing traffic, offers per listing, and how aggressively buyers bid over list, and only later in closed prices. Those early indicators are the ones to watch over the next 60 to 90 days.
For a sense of scale, on a $1,160,000 loan — 80 percent of the Hills’ $1.45 million median — the move from 6.5 percent to about 7 percent adds roughly $410 a month in principal and interest. That’s a real number, but it tends to reshape how buyers structure offers and where they set their price ceilings rather than pushing them out of the market entirely. Loans at this size are often jumbo loans, which are priced differently than the conforming loans in Freddie Mac’s survey, so actual rates will vary by borrower and lender.
It’s also worth separating the national conversation from what’s happening street by street in the Hills. National rate coverage often reflects markets with far more available inventory, where an extra half point can noticeably cool buyer activity. Where active supply is this limited, buyer competition has historically absorbed a good share of rate movement. Whether that holds at 7 percent is the open question for this fall.
A Note on the Data
The Oakland Hills figures in this post reflect MLS activity for detached homes during the spring-and-summer 2026 window. Mortgage rate figures are from Freddie Mac’s Primary Mortgage Market Survey as of September 24, 2026. Both will shift, so a current read on your specific neighborhood and price point is always the better guide.
Turning This Data Into a Listing Strategy
Market-wide numbers are useful for understanding direction, but they only translate into results when they’re applied to an individual property with a specific pricing and marketing plan. A few practical takeaways stand out.
- Pricing sets the pace. The gap between a 13-day median for sold homes and a 27-day median for active listings usually traces back to how a home was priced against its true comparables, not to overall buyer demand. With rates higher, pricing precision matters even more.
- Presentation still earns its keep. Buyers paying more to borrow are pickier about condition. Homes that show well and are marketed effectively are the ones that capture the competition that’s out there.
- Timing windows can close. Inventory this limited won’t necessarily stay this limited, and higher rates could thin the buyer pool at the margins. If both happen at once, today’s scarcity-driven leverage could soften.
- Watch the leading indicators. Overbid percentages, offers per listing, and days on market for new listings will show whether 7 percent rates are changing buyer behavior well before closed prices do.
So, Should You Sell Now or Wait?
There’s no single answer that fits every homeowner or property, but the data points in a fairly clear direction. Inventory is thin, absorption is high, well-priced homes have been moving in under two weeks, and buyer competition has been strong enough to produce multiple offers on most sales. Those conditions typically favor sellers.
The case for waiting usually comes down to two things: personal readiness, such as needing more time to prepare a home for market, and a bet that conditions improve. With rates now climbing rather than falling, that second bet is harder to make. Waiting for rates to come back down is a forecast, not a guarantee, and in the meantime more inventory or a thinner buyer pool could work against sellers rather than for them.
For homeowners who are otherwise ready, pricing strategically and listing while inventory remains limited tends to produce a faster sale and a more competitive outcome than waiting for better conditions that may not arrive. A current home valuation is the best way to turn these market-wide numbers into a plan for your specific property, timeline, and goals.
Frequently Asked Questions
Is now a good time to sell in the Oakland Hills?
Recent data suggests conditions still favor sellers: active inventory is limited, well-priced homes sold in a median of 13 days during the spring and summer, and most sales closed above list price with multiple offers. Rising mortgage rates are worth watching, and individual timing depends on a homeowner’s readiness and goals.
How long are Oakland Hills homes taking to sell right now?
Homes that sold during the spring-and-summer 2026 window went pending in a median of 13 days and an average of about 16 days. Homes still active averaged closer to 31 days, which often points to pricing or positioning rather than a lack of buyer demand.
Are Oakland Hills homes selling above or below asking price?
The large majority sold above list price, with about 86 percent of recent sales closing over asking and 66 percent drawing multiple offers. This partly reflects a common local strategy of listing below anticipated value to generate competition, so it should be read alongside pricing strategy rather than as pure appreciation.
How are today’s mortgage rates affecting Oakland Hills home prices?
The 30-year fixed rate averaged 7.03 percent as of September 24, 2026, according to Freddie Mac, up from 6.30 percent a year earlier. Spring and summer sales data didn’t show rates suppressing Oakland Hills prices, but the recent jump is too new to appear in closed sales. Overbid levels and offers per listing will show its effect first.
What does a low active listing count mean for sellers?
A low active count relative to recent sales, near an 82 percent sell-through rate in the Hills, typically means less competition among sellers and more negotiating leverage, since buyers have fewer comparable homes to choose from.
Should I wait for mortgage rates to drop before listing my home?
Waiting on rates is a forecast, not a guarantee, and rates have recently been rising rather than falling. For homeowners who are otherwise ready, listing while Oakland Hills inventory remains limited tends to produce a faster, more competitive sale than waiting on a rate change that may not arrive.
About Tracy Butler
Tracy Butler is an East Bay Realtor® with Vanguard Properties (DRE# 01342671 | Vanguard Properties DRE# 01486075) and has been helping clients buy and sell homes in Oakland and the surrounding communities since 2002. She specializes in the Oakland Hills — including Montclair, Piedmont Pines, Joaquin Miller, and Upper Rockridge — and brings deep local knowledge alongside a marketing background to every transaction.